TPI Tuesday – Vegetation Clearance Detected

On behalf of the entire Orbital Eye Team, we want to wish you a Happy New Year! 🥂

We have all enjoyed a relaxing holiday and are now ready to continue with current projects and start up multiple new projects soon (stay tuned!). And of course, we will keep presenting detected activities in our #TPITuesdays.

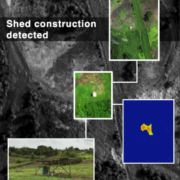
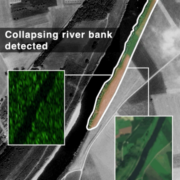
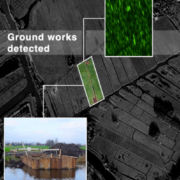
In today’s TPI Tuesday, you can see a clear example of vegetation clearing. Now that the holiday is over, multiple construction activities are started up. Vegetation clearing often is the first step in a construction activity – which is why our system is designed to also detect and report vegetation clearance as this enables our customers to be aware of construction activities around their pipelines in an early stage already!

Are you curious how our satellite-based monitoring service can help your company in 2022? Feel free to send an email to info@orbitaleye.nl and we are happy to think along with you!

TPI Tuesday – Shed Construction Detected

We often get the question what kind of activities we are able to detect with the CoSMiC-EYE monitoring technology and what the minimum size of an object should be before the radar satellite can detect an event. This question is very relevant, as the resolution of the Sentinel-1 satellite is 10 meter, which could make you think that objects or activities need to be at least 10 meter big before we can detect it.

However, we have many examples of where we detected an object or activity that it far smaller than 10 meters. This is mainly because our algorithms are also able to pick up scattering characteristics, and the phase, of the radar signal. The polarisation and phase of the radar signal tells something about the type of activity or event – which we also use to filter out irrelevant activities.

Today we present an example of a small shed that we detected in Trinidad and Tobago. What do we see in the GIF?

  • An on-site picture of the shed (which is far smaller than 10 meter!)
  • The radar imagery (with different polarisations) that was analysed to construct the change-blob and detect the shed
  • High-resolution optical imagery of before and after the shed was constructed

The data in this post was provided by several of our partners:

  • https://www.skywatch.com/
  • https://www.esa.int/
  • https://ngc.co.tt/

TPI Tuesday – Pipeline Repairs Detected

Last week we showed you that we detected the collapsing river bank in Limburg. This week, we are showing the detection of the works that followed this collapse, which are also described in this post of Visser & Smit Hanabhttps://lnkd.in/eeFX2Jpw:

What do we see in today’s GIF?

  • That repair works were detected at 4 different locations around the river, indicated by change blobs. These change blobs are automatically constructed by CoSMiC-EYE through analysis of a stack of weather independent SAR imagery.
  • High-resolution optical satellite imagery that was acquired after the repair works were detected through the SAR-imagery.
  • Sentinel-2 imagery (bottom-left picture) in which the works can be seen as well.

The advantage of using SAR imagery is that independent of whether there are clouds or not, activities can be detected. Besides, in order to also assess what’s going on exactly at the location where an activity is detected, we automatically task optical satellites to acquire an optical image for the location as soon as possible after the event was detected.

TPI Tuesday – Collapsing river bank detected

This time, we want to showcase the detection of an event related to the flood that happened in the Netherlands this summer. In Limburg, the floods caused the collapsing of a riverbank, which led to pipeline exposure, which in turn led to a leakage. You can read all about it in this news article: https://lnkd.in/eYikm6bg

In the news article, it says that the pipeline exposure and leakage was detected in the morning on Monday the 19th of July via a routine control activity. Orbital Eye analysed radar images for this location, and saw the event was already visible on radar images of Saturday the 17th of July.

What do we see in the GIF?

  • In the background: high-resolution optical images of before, and after the river bank collapsed.
  • In the pop-up picture on the left: radar images, and the change detection image, where the change is the collapsing of the river bank.
  • In the pop-up picture on the right: Sentinel-2 images of before and after the event. These are medium-resolution optical images, but the collapse can be seen here as well. At Orbital Eye, we combine data from different satellites to detect events. However, in this case we see that the event was detected in 3 different satellite types!Next TPI Tuesday, we demonstrate what we detected at this location after the detection of the river bank collaps. Stay tuned!

Introducing TPI Tuesday!

At Orbital Eye, we use satellite data to detect Third Party Interferences (TPIs) close to pipeline networks. On this news page, you will find regular posts related to TPIs that were detected by our monitoring system CoSMiC-EYE.
Today we present a TPI where a bridge was built in the middle of a meadow.
In the GIF, you can see:

  • In the background: a high-res SAR image
  • In the pop-up picture in the bottom left: an on-site picture of the detected activity
  • In the pop-up picture in the top right: the SAR imagery that was analyzed to detect this activity
  • The small picture in the middle: a high-res optical image of the meadow